Projects & Writing
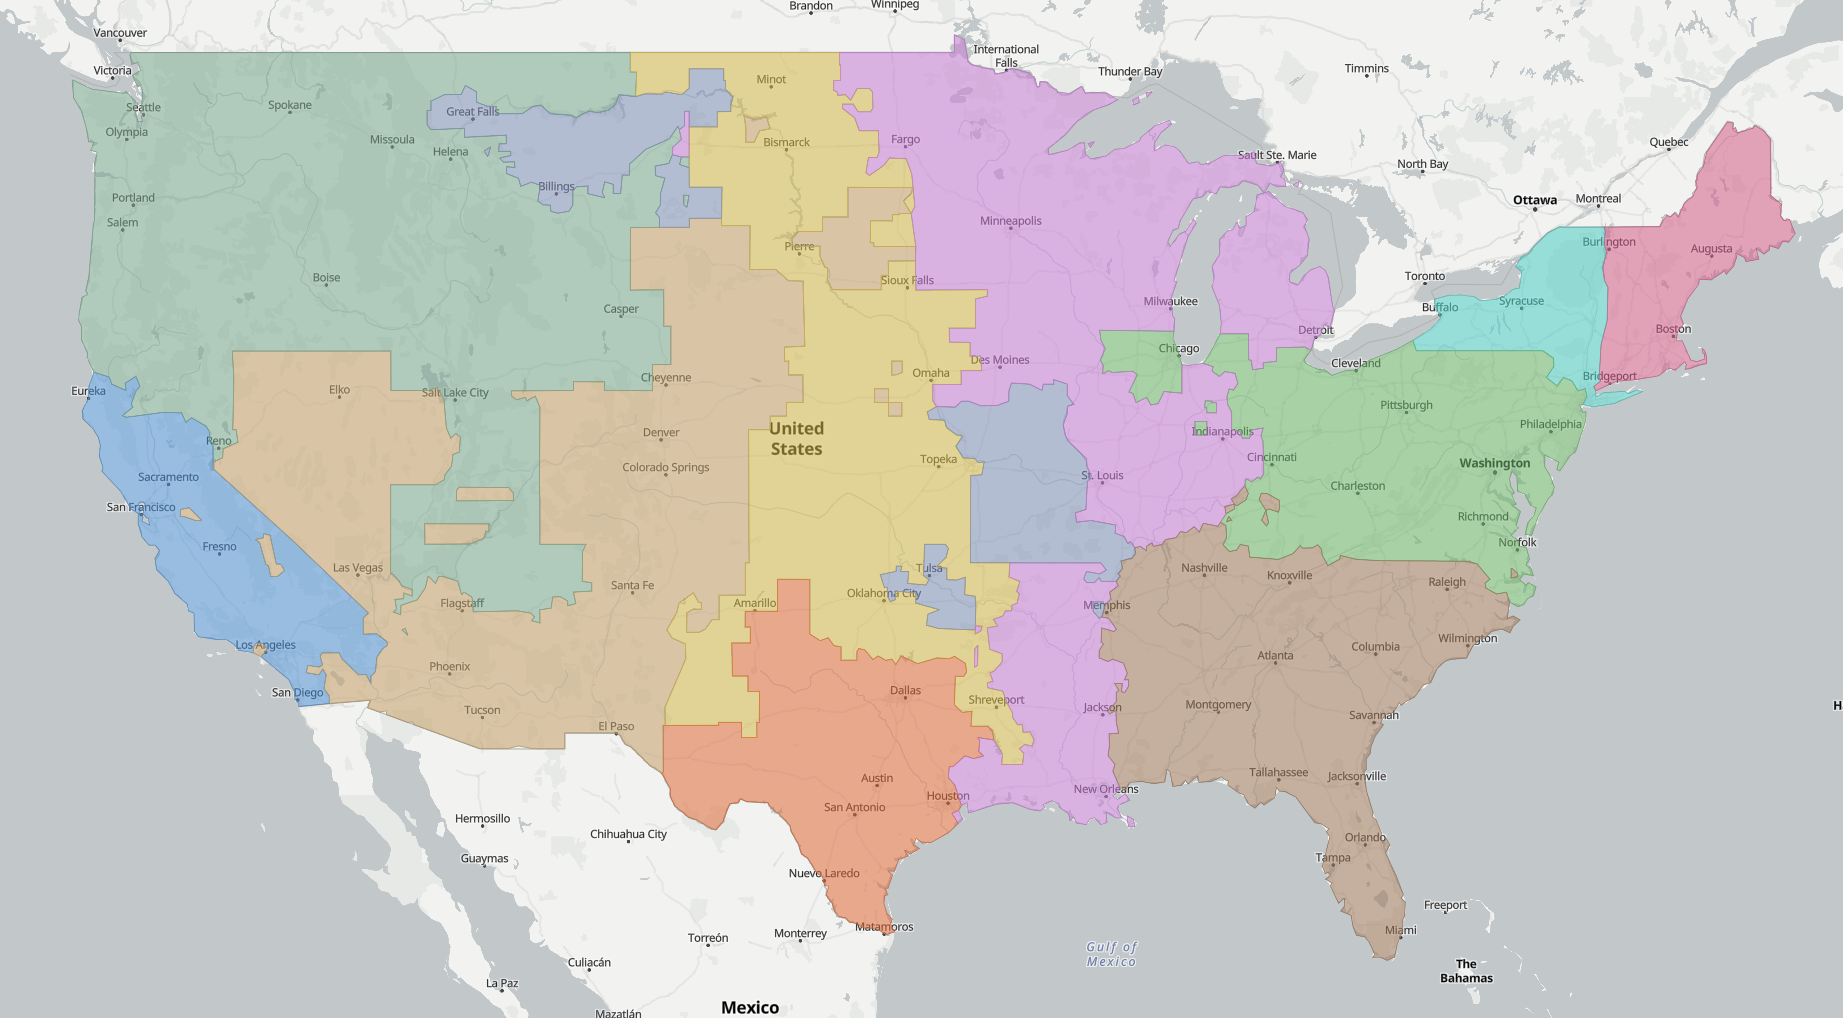
How the US Electric Grid Is Organized
A step-by-step interactive map explaining the overlapping layers of the US power grid that explains interconnections, ISO/RTO markets, balancing authorities, NERC regions, and transmission planning entities.
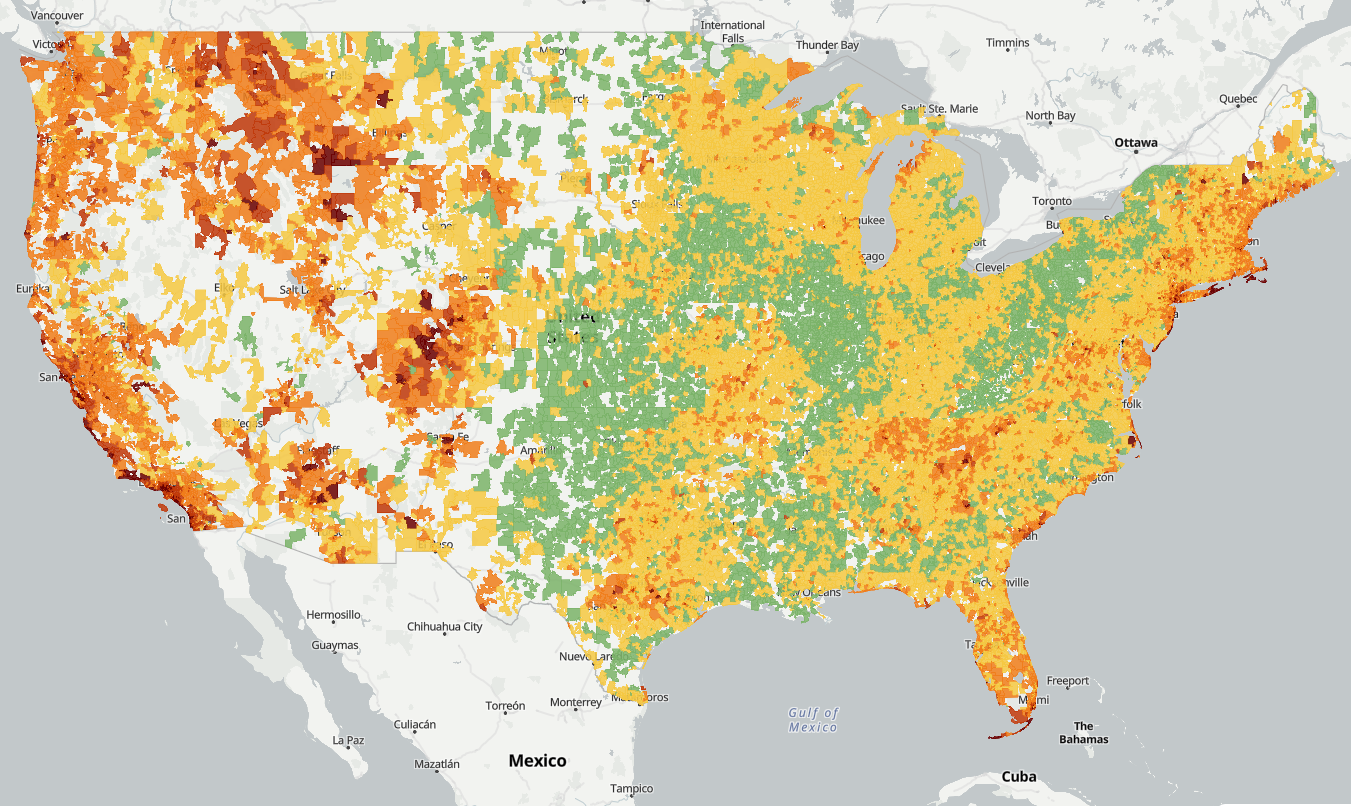
Where Buying a Home on a Single Income is Practically Impossible
This map shows the price-to-income ratio for over 25,000 US zip codes. Only 23% of zip codes meet the conventional 3x affordability threshold.
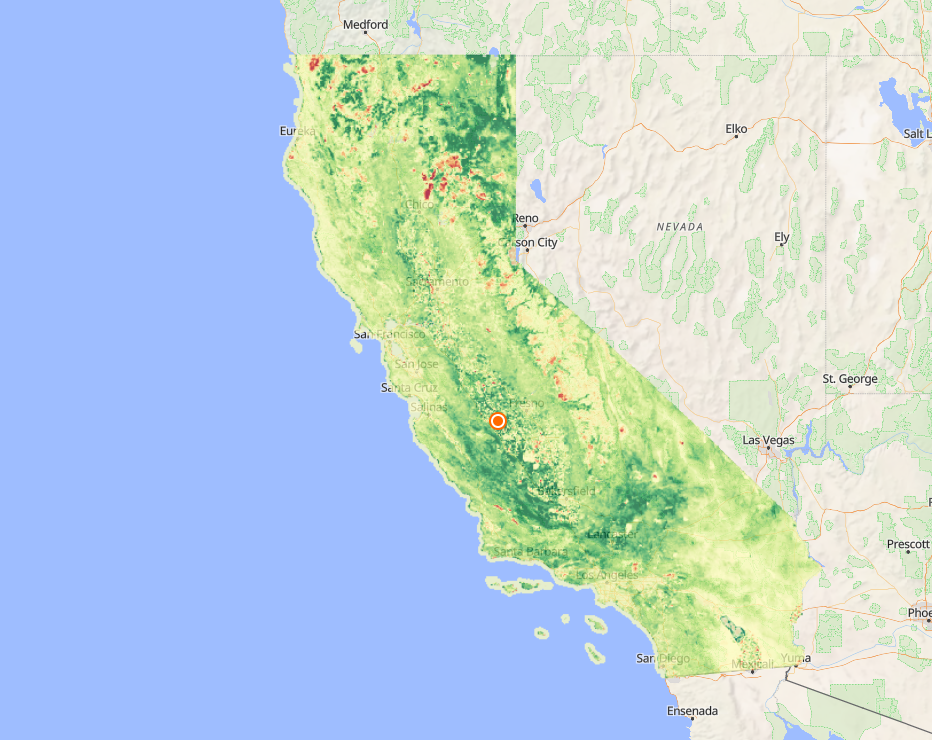
CA NDVI Anomaly Viewer
Interactive map showing vegetation stress across California relative to a 6-year historical baseline, powered by MODIS satellite data.
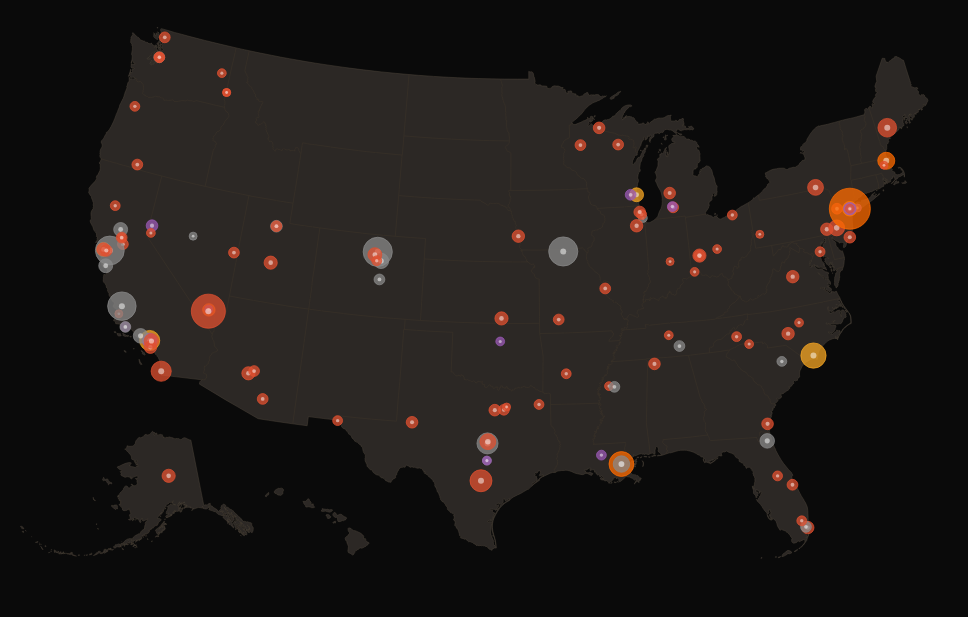
Spree Killings in America
An animated timeline map of spree killings in the United States from 1863 to present. Events pulse onto a dark D3/SVG map chronologically, sized by death toll and colored by weapon type.
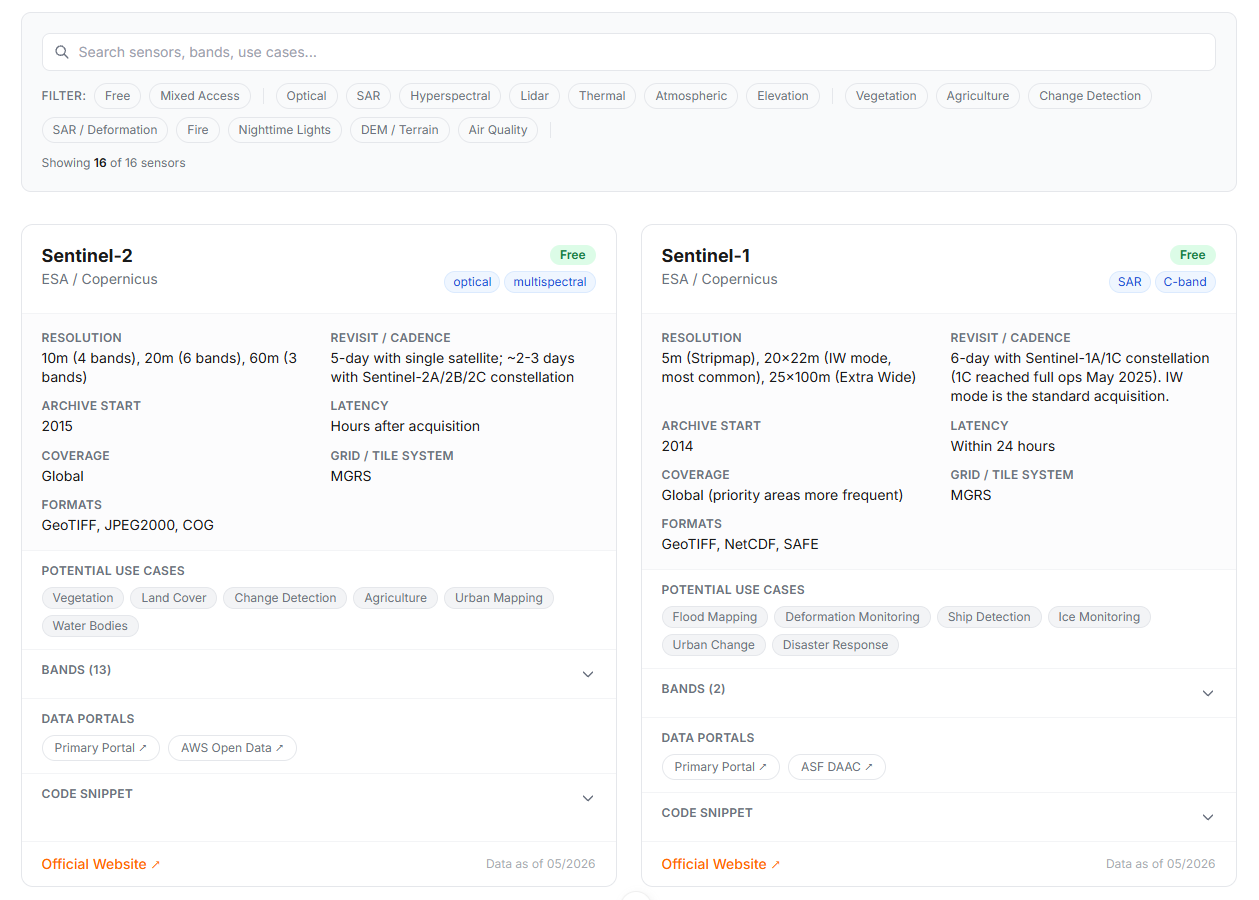
Satellite Data Reference
A consolidated reference for free satellite data sources. Includes resolution, bands, revisit times, and access portals for 16 sensors.
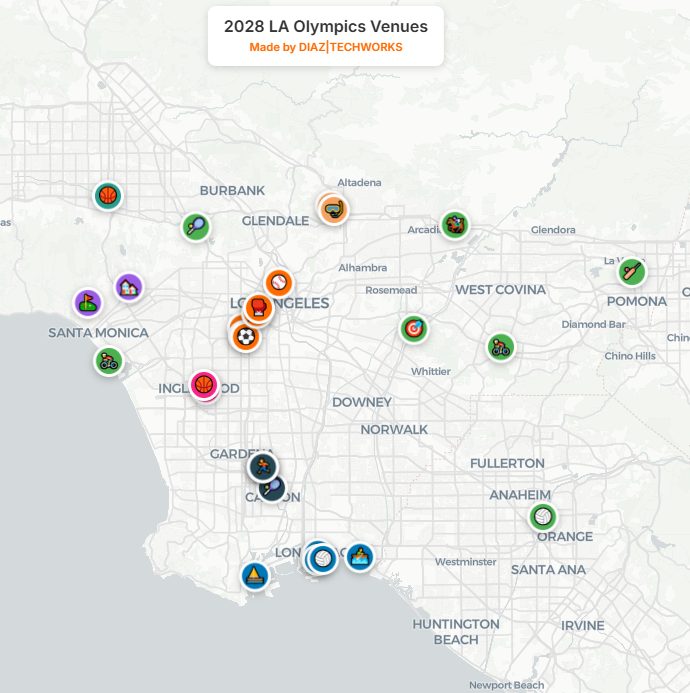
LA 2028 Olympics Venue Map
Interactive map of all 2028 Olympic venues across Los Angeles and the broader United States.
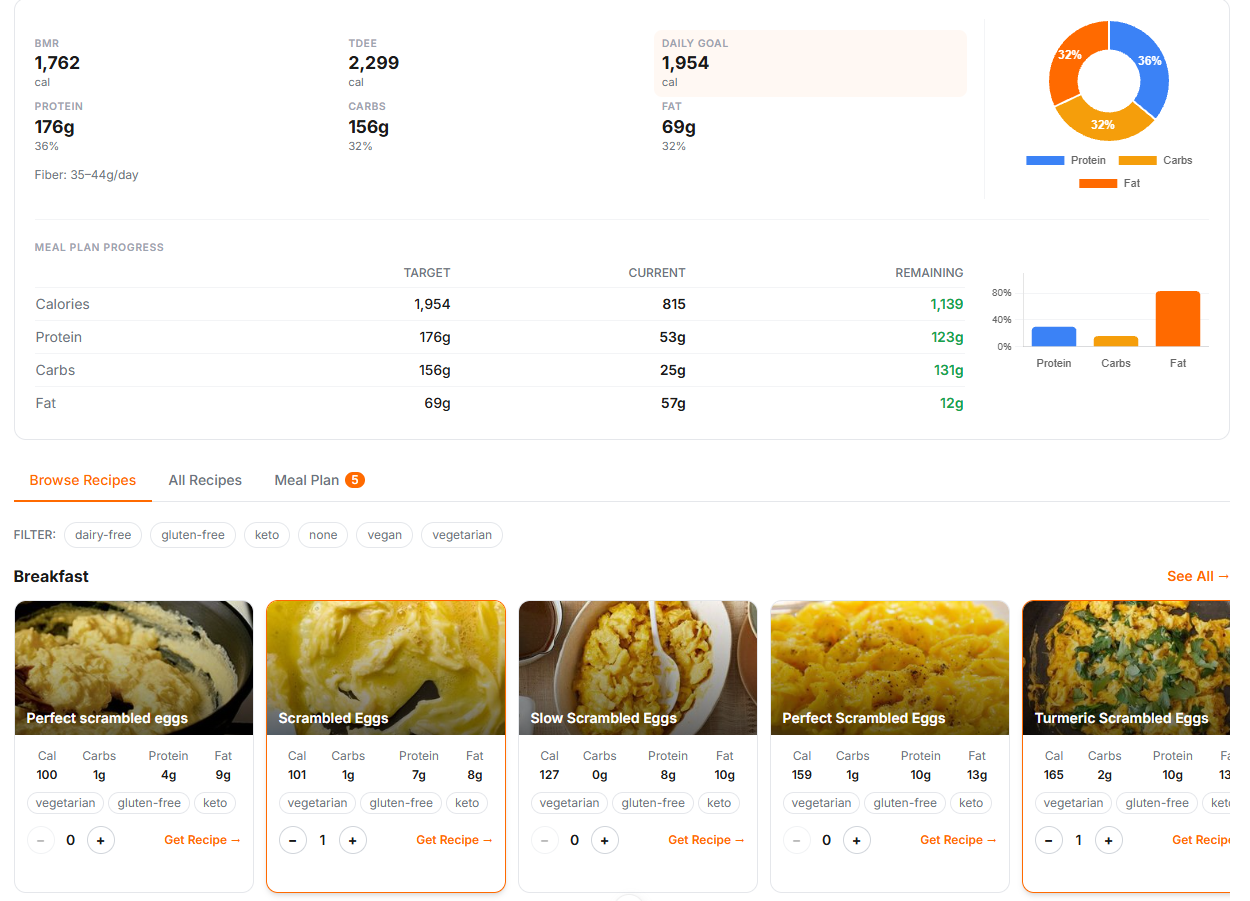
Macro Calculator
Calculate your BMR and TDEE, set a fitness goal, choose a macro split, browse recipes, and build a daily meal plan - all in one tool.
Log It! Home
A home logistics management application for tracking inventory, maintenance schedules, and household tasks.
Let's Build Something
Have a project or idea in mind? Reach out and let's talk.